Introducing R analyses
It's now possible to run analyses in StatsCloud using R
It's now possible to run analyses in StatsCloud using R
Since we released statscloud, we've been really proud of lots of things about it; the lovely, slick user-interface, the accessibility, and the fact that the app is free and available to use by anyone on any device. However, one thing we've always been a bit shy about is the amount of analyses we have on offer.
For years, we've tried to accommodate the needs of most social scientists, but it's no secret that the app has fallen short of these needs in some respects. There were limits to how big ANOVAs could be, there some other missing tests, some missing follow-up tests... In the situations when you needed these, we simply said: "oh, you'll need to use R for that".
Last year, we introduced an R terminal into the app to let you do exactly that. Thanks to the magic of WebR, our R terminal is just a click away in the Code tab so you can jump over to that at any point. However, this was really just the start. With our latest version of statscloud, we've now progressed to having statistical modules powered by R built right into the app.
Let's have a look.
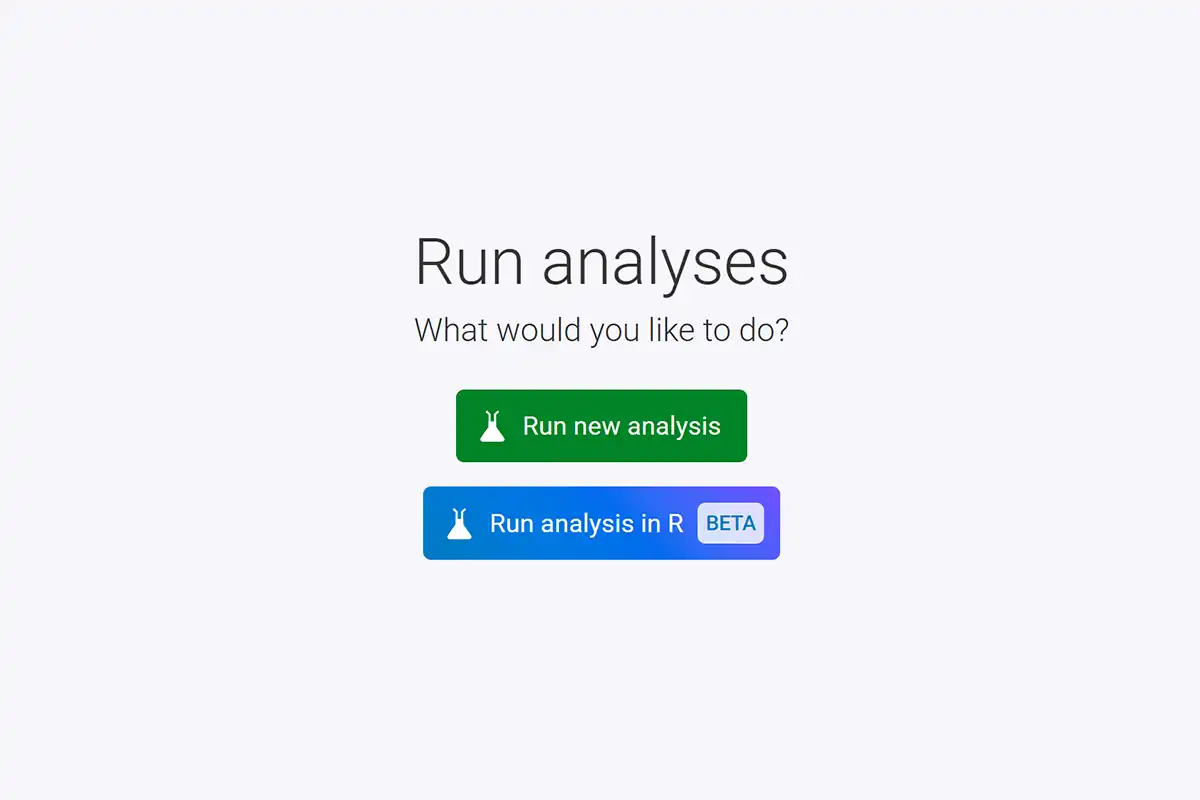
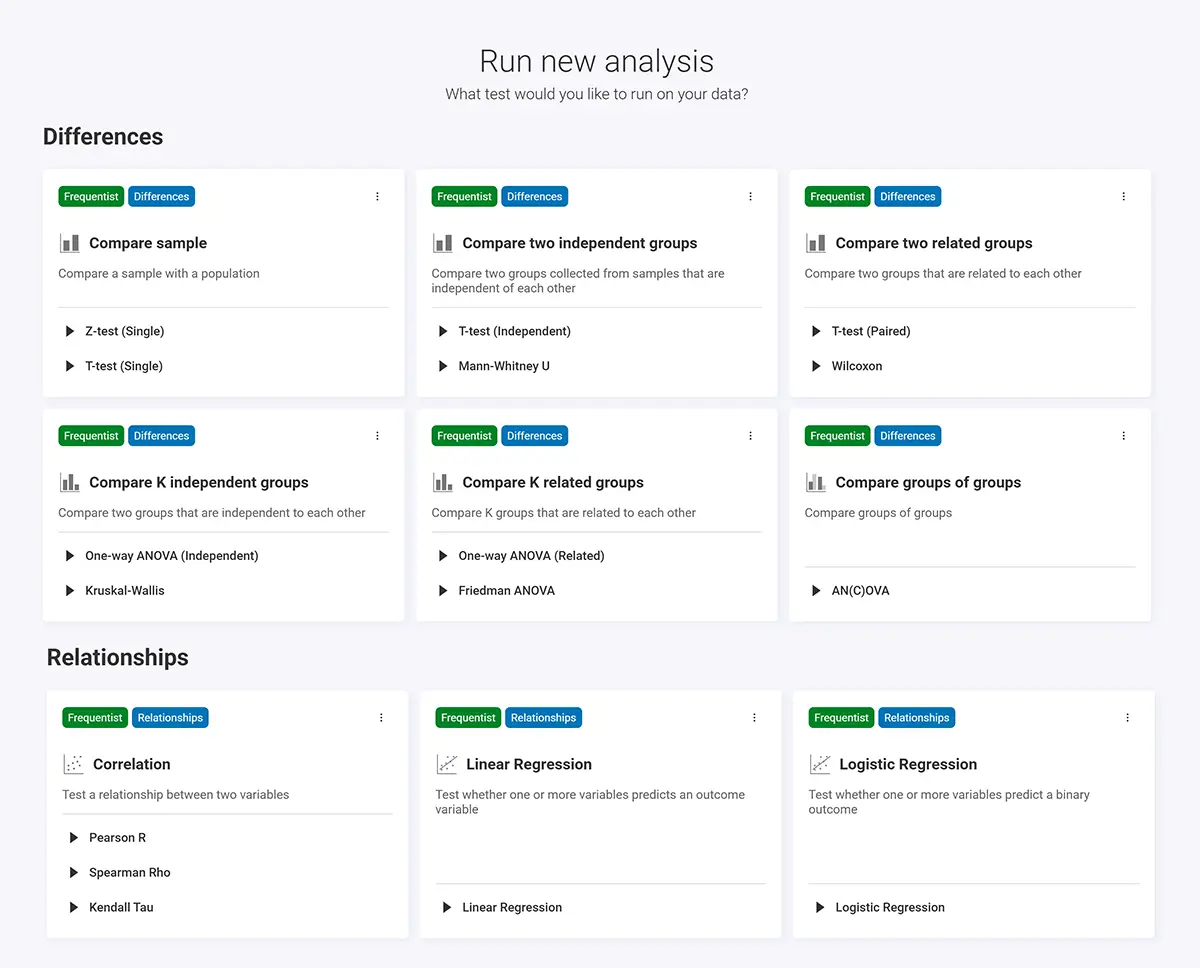
If you head over to the analyses tab, you'll now see an enticing new button labelled: "Run analysis in R". Clicking on this will whisk you away to a screen full of analyses, all written in R. You can select a test, just as you can in the classic interface, define your variables, and then hit "Run analysis".
When the analysis has run, you'll see the output for this displayed in our usual easy-to-digest analysis view. It's all there; charts, tables of results, and even some highlights and text summaries of your tests to boot. However, there's no evidence of any R code here, so what's going on?
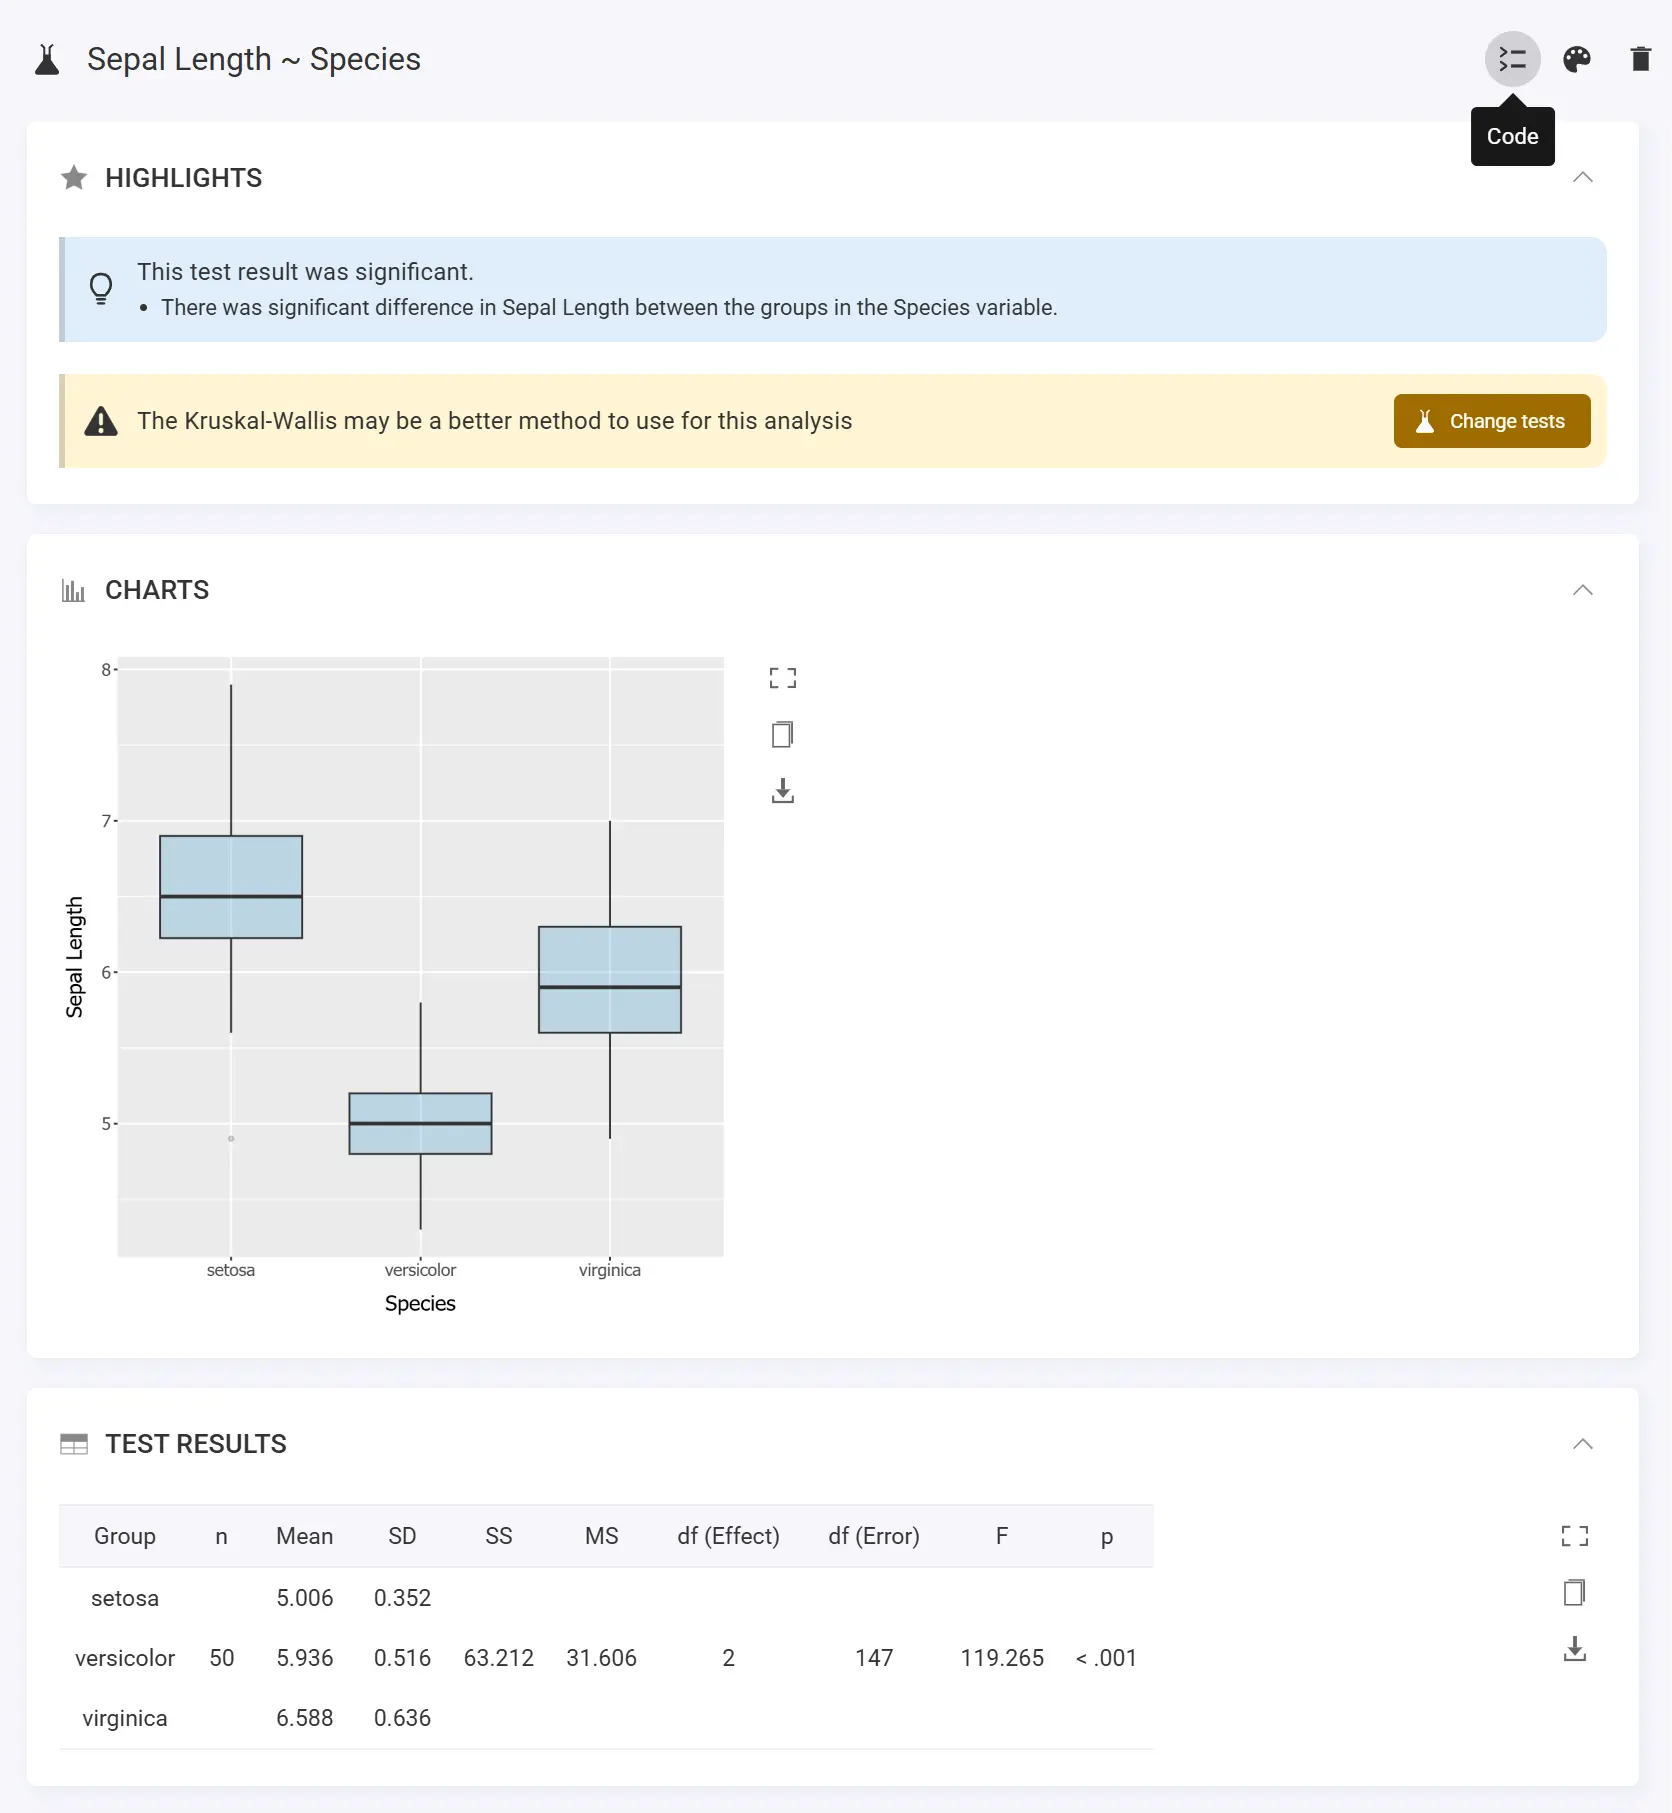
Even though you cannot see the R code, it is responsible for all the results you see here. The secret is in the code button you can see at the top of the analysis. If you give that a click, everything will become clear. You can see what R code was executed by statscloud to generate all the results you see in the analysis preview.
If you're not a programmer, you might not find this very interesting. If you are, you probably still won't. However, we feel this is important to include as we edge closer to making sure all the good bits of statscloud are fully open-sourced. I think this is a great way of doing this; all of the code you need is right there on the same page so there's no need to leave the app and go hunting around for it online.
You'll notice too that we've taken the opportunity to shuffle a few things around in the analysis interface too. All the options for your analyses can be found in the toolbar on the right (just like the Charts and Code tabs) and all the key tools for your analysis can be found in the small toolbar at the top. We've even added the option to label each analysis with a colour so you can identify them easily. Little things.
You may have noticed that this R analysis feature is in beta. It works, but there is much we can do to improve it. Right now, running analyses via R is a little slow. I could write a blog explaining why this is the case, but it would be so boring you probably wouldn't make it to the end. Instead, let me just reassure you that there's a little tinkering we need to do to the user-interface to make sure R loads up in the background ready for you so we can cut down on these load times massively.
In some situations, you may find it better to use the classic analyses user-interface in the app which is powered by our own statistics library. This is bundled into your statscloud installation so it works offline and is super fast. However, the pros and cons of using the classic and new R analyses can be a little tricky to explain, so here's a handy table to help you decide when is the best time to use the new R analyses and when to use the classic ones:
| Feature | Classic analyses | R analyses |
|---|---|---|
| Offline access | Yes | No |
| Suite of analyses | Limited | Full |
| Save calculated variables to data set | Yes | Coming soon |
| Add filters to an analysis | Yes | Coming soon |
| Split data by variable | Yes | Coming soon |
| View formulas for table values | Yes | Coming soon |
| View code | No | Yes |
As you can see, in the future, the R analyses will provide the best offering, so we will be focusing our efforts on that in the future. However, we recognise the importance of having a statistics package that can run offline on any device, so we'll always have the option to use our classic analysis library when you need to.
As well as adding in some extra analyses, we'll also be experimenting with Python so we can open up our analyses suite even further. That's not even the best bit though; the next thing we're developing is an interface where you can write your own modules for R and embed these in the app so you can run them on any of your projects in the future and share them with others. We're going to make this super easy to do, and are now building a 'development' wing to the app to let you do all of this right inside the app.
Do stick around, because things are about to get very interesting.